IA 342: Visualization Methods, Technologies, and Tools for Intelligence Analysis
IA 342: Visualization Methods, Technologies, and Tools for Intelligence Analysis
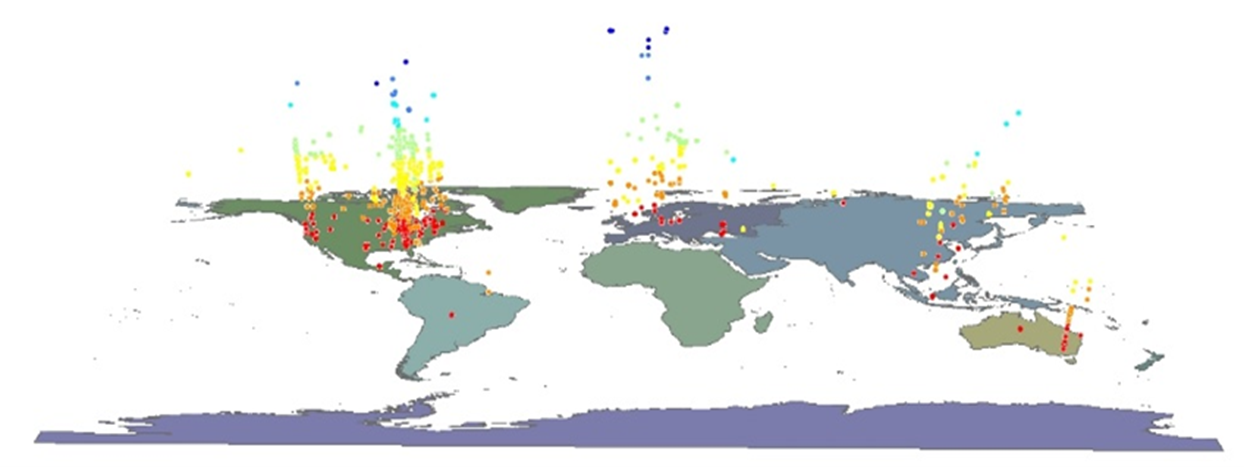
Use Business Intelligence and visualization to help people understand complex data.
📖 Course Syllabus
Review the Fall 2026 course policies, grading structure, and official AI guidelines.
🚀 Module 1
Course Introduction and the Value of Visualization.
📝 Week 1 Assignment
Complete the System Access and Account Setup (ArcGIS & Google Account).
Course Overview
IA 342 is designed to bridge the gap between raw data and human decision-making. While computational tools and Artificial Intelligence can rapidly organize and analyze vast amounts of data, humans still bear the ultimate responsibility for intelligence judgments and actions. This course empowers students to use Business Intelligence (BI) and visualization techniques to help people perceive patterns, understand context, and make clear, evidence-based visual communications.
Throughout the semester, we focus on the theory of visual design and the practical application of industry-standard platforms, specifically ArcGIS and Tableau. We move from foundational spatial analysis to exploratory data visualization, and finally to the creation of interactive, professional-grade visual analytics dashboards.
Course Roadmap / Major Modules
The course is structured to take students from raw data to actionable human understanding:
Data ➔ Visual Design & Spatial Analysis ➔ ArcGIS ➔ Tableau & Visual Analytics ➔ Interactive Dashboards ➔ Human Understanding & Decision
- Course Introduction: The core philosophy of why visualization matters in the AI era.
- Spatial Intelligence (ArcGIS): Map design, geographic contexts, and spatial data visualization.
- Mini Project / Checkpoint: A milestone project applying spatial visualization techniques.
- Business Intelligence (Tableau) & Visual Analytics: Data connection, charts, calculations, filters, and interactive dashboards.
- Data Storytelling: End-to-end projects culminating in a comprehensive visual analytics Final Project.
Official Course Information
IA 342 is a core component of the Intelligence Analysis curriculum at James Madison University.
- Curriculum: JMU Intelligence Analysis Academic Curriculum
- Term: Fall 2026
Instructor
Dr. Xuebin Wei
Associate Professor, James Madison University (Geography / Intelligence Analysis)
Email: weixx@jmu.edu
Profile: Official JMU Faculty Profile
Biography: Dr. Wei’s teaching and research focus on data science and artificial intelligence, cloud computing, GIS and geospatial analysis, and social data analytics. He is the co-author of Social Data Analytics in the Cloud with AI.
Repository / Reuse / Privacy Boundary
This repository (JMU-Data/IA342) serves as the canonical public source for course materials, built with a “source-first, web-published” approach via GitHub Pages. The materials here are designed for transparency and reuse.
To protect student privacy and maintain operational security, this repository strictly contains public-facing content. All private grading, student submissions, personally identifiable information (PII), and Canvas LMS automation scripts are managed entirely outside this environment.